
Think debugging means reading error stacks for hours? Think again.
Browser DevTools and the Console let you find and fix JavaScript bugs in minutes.
I’ll show you how to open DevTools, use console.log and colored logs, explore variables and the DOM, and pause code with breakpoints.
No fluff, just hands-on steps you can try in your browser right now.
By the end you’ll trace errors, test fixes live, and feel confident stepping through code.
Opening Browser DevTools and Console for JavaScript Beginners
DevTools live inside every modern browser. They give you a bunch of panels that let you inspect, modify, and debug code. The Console panel is where you’ll probably start, because it’s basically an interactive playground where you type JavaScript and get results right away. Instead of writing code in a file, saving it, and reloading the page every time, you can test stuff directly. That instant feedback makes the Console the fastest way to figure out how JavaScript actually works.
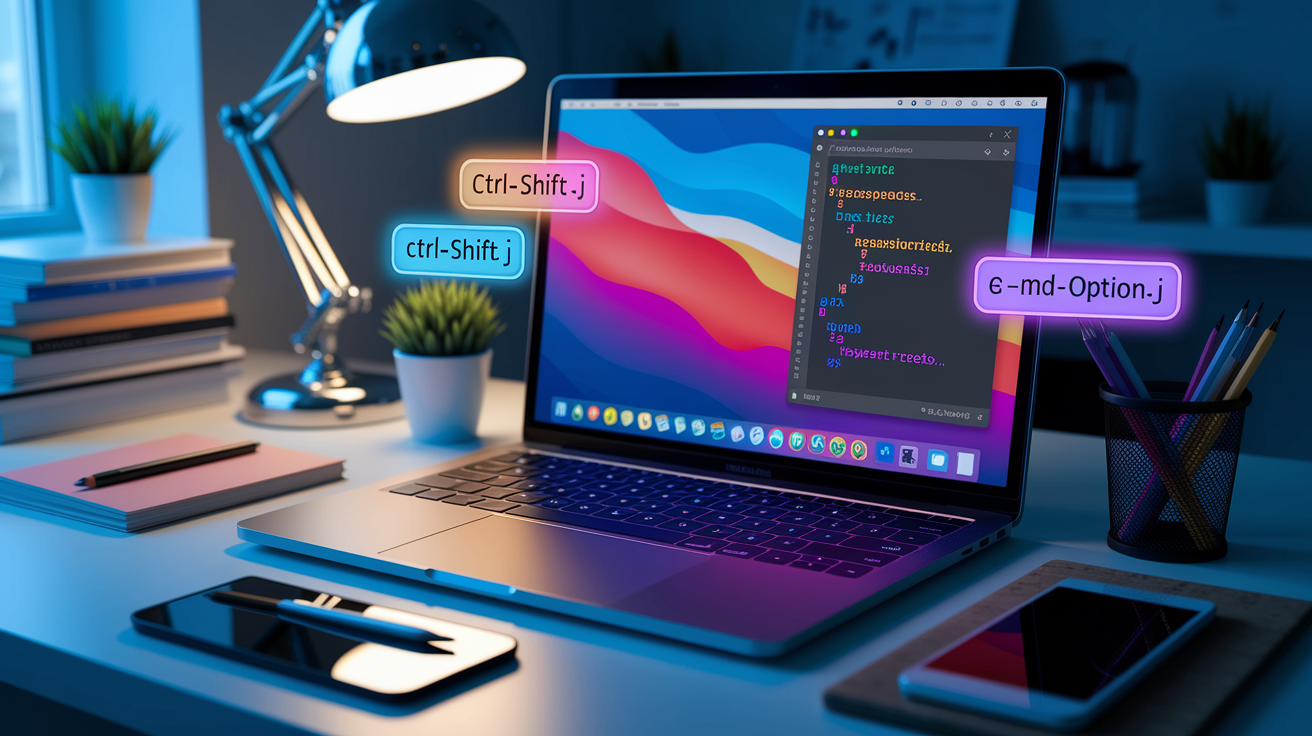
Getting to the Console in Chrome is easy. Click the three dots in the upper right, then go to More Tools → Developer Tools. Once DevTools opens, click the Console tab. Faster option: press Ctrl + Shift + J on Windows or Linux, or Command + Option + J on Mac. Firefox is similar. Click the menu icon (the three lines), pick More Tools → Web Developer Tools, then click Console. Or use Ctrl + Shift + K on Windows and Linux, Command + Option + K on Mac. Browser updates tweak the UI a bit, but these shortcuts stay the same.
Once the Console opens, you’ll see a blinking cursor. Type alert("Hello, World!"); and hit Enter. A popup appears, one of those annoying browser dialogs that blocks everything until you close it. Now type console.log("Hello, World!"); and press Enter. This time the message just prints in the Console without stopping the page. Big difference. console.log is invisible to users and great for debugging. alert stops everything and bugs real visitors.
You’ve got a few ways to open the Console fast:
- Right click any element on a webpage and choose Inspect or Inspect Element, then click the Console tab.
- Use the menu: three dots → More Tools → Developer Tools → Console.
- Use the keyboard shortcut (Chrome: Ctrl+Shift+J / Cmd+Option+J, Firefox: Ctrl+Shift+K / Cmd+Option+K).
- Click the little console icon in the DevTools toolbar (looks like
>_or>>) to pop open a console pane below whatever panel you’re in.
Core Console Commands and Logging Techniques for JavaScript Beginners

console.log() is your go-to debugging tool. Pass in a value or variable like console.log(user) and the Console prints what’s inside. Unlike alert(), which turns everything into a string and freezes the page, console.log shows structured objects, arrays, and live values without interrupting anything. You can log multiple things at once. console.log("Count:", count, "User:", user) prints all the arguments separated by spaces. If you type a simple expression like 2 + 6 straight into the Console, the result (8) shows up below. Expressions that don’t return anything print undefined, which just means “this ran but didn’t produce output.”
console.error(), console.warn(), and console.info() work like console.log() but add color coding. console.error("User not found") prints in red with a red X and includes a stack trace showing where the error happened. Perfect for catching bugs. console.warn("Deprecated method") shows up in yellow with a warning triangle. console.info("Data loaded") gets a blue info icon. DevTools let you filter by message type, so you can hide regular logs and see only errors when debugging. These flags help you organize output and spot problems faster.
console.assert(expression, message) only logs when the expression is false. Write console.assert(count > 10, "count is not larger than 10") and if count is 5, the message appears. If count is 15, nothing prints. console.clear() wipes the Console clean, which helps when logs pile up and you need a fresh view. Want styled output? Use the %c format specifier: console.log("%cStyled text", "color: blue; font-size: 20px;") prints “Styled text” in blue at 20px. You can also write multi-line code in the Console by pressing Shift + Enter instead of Enter. That way you can declare a variable on one line and use it on the next without running halfway through.
Try these examples. Type console.log(2 + 6); and see 8. Type console.log(34348.2342343403285953845 * 4310.23409128534); and watch the Console print a long decimal. Type let today = new Date(); console.log("Today's date is " + today); on two lines (Shift+Enter after the semicolon) to see today’s timestamp. Type console.log("%cHello", "color: red; font-weight: bold;"); to get red bold text. Small wins, but they prove the Console is live and ready.
Using the Console to Explore Variables, Objects, and the DOM
The Console doesn’t exist in a vacuum. It runs inside the page’s JavaScript context, which means you can access every global variable, function, and DOM node on the page. If your script has let user = { name: "Alice" };, typing user in the Console prints the object. Typing user.name prints "Alice". You can call any function you’ve defined, change variables, and see the results right away. The Console also gives you direct access to the DOM. document.body returns the <body> element, document.querySelector("h1") grabs the first heading, and document.querySelectorAll("button") returns a list of all buttons.
You can modify HTML and CSS on the fly. Type document.body.innerHTML = "<h1>Today's date is " + new Date() + "</h1>"; and the whole page body gets replaced with a single headline showing the current date. Type document.body.style.backgroundColor = "lightblue"; and the background turns light blue. Type document.body.style.color = "white"; to change text to white. Want to add elements? Try let p = document.createElement("p"); let t = document.createTextNode("Paragraph text."); p.appendChild(t); document.body.appendChild(p); to create a paragraph, insert text, and stick it on the page. Keep in mind these changes are live but temporary. Reload the page and everything resets. To keep edits, copy your code into a text editor and save the file.
Here’s when to use specialized Console helpers:
console.table([{id:1, name:"A"}, {id:2, name:"B"}]);renders arrays and objects as a sortable table. Great for inspecting API responses or lists of data.console.dir(document.querySelector("header"));shows a DOM node’s properties as a JavaScript object instead of markup. Helpful when you need to check attributes, event listeners, or internal properties.console.dirxml(document.body);prints an element’s XML/markup representation (similar toconsole.logfor DOM nodes).$("h1")works as shorthand fordocument.querySelector("h1")in Chrome and Firefox. Grabs the first matching element.$$("div")is shorthand fordocument.querySelectorAll("div"). Grabs all matching elements as a NodeList.
Beginner Debugging Workflows with Browser DevTools
When your JavaScript breaks, the Console highlights the error in red and prints a stack trace that shows exactly where things went wrong. You’ll see the error message, something like “Cannot read property ‘city’ of undefined,” and below it a list of files and line numbers. Click any line number and DevTools jumps to that spot in the Sources or Debugger panel. This instant connection between error and code is your first debugging superpower. No more guessing where the bug lives.
Breakpoints let you pause code mid-execution and inspect everything at that exact moment. Open the Sources panel (Chrome) or Debugger panel (Firefox), find your script file, and click a line number to add a breakpoint. A blue or red marker appears. Reload the page or trigger the code, and execution stops at that line. Now you can hover over variables to see their values, step through the code one line at a time, and watch how data changes. Press F8 to resume, F10 to step over (run the current line and move to the next), F11 to step into (dive into a function call), and Shift + F11 to step out (finish the current function and return to the caller). Conditional breakpoints are even better. Right click a line number, choose Edit breakpoint, and type a condition like count > 10. The debugger only pauses when that condition is true, so you can skip irrelevant loops and zero in on the exact state that causes bugs.
Don’t feel like clicking around? Drop debugger; straight into your code. When DevTools are open, execution pauses at that line as if you’d set a breakpoint manually. Useful for debugging callbacks or async code where setting breakpoints feels clunky. Once paused, you can use the Console to run expressions, check variable values, and test fixes. Everything you type runs in the paused context, so you can validate assumptions before editing your source file.
Viewing Scope and Call Stack
While paused at a breakpoint, the Scope pane shows every variable you can access at that moment, organized by scope: local variables, closure variables, and globals. The Call Stack pane shows the sequence of function calls that led to the current line. Click any frame to jump back in time and see what values looked like earlier in the chain. These panes answer “how did I get here?” and “what does my code see right now?” Two of the most important debugging questions for beginners.
Inspecting HTML, CSS, and Layout with Elements/Inspector Tools

The Elements panel (Chrome) or Inspector panel (Firefox) shows your page’s DOM as a live, interactive tree. Each HTML tag appears as a collapsible node. Click the triangle to expand and see child elements. When you select an element, the Styles pane on the right shows all the CSS rules that apply, listed by specificity, with overridden rules crossed out. The Computed tab shows the final calculated values for every CSS property. The Box Model diagram visualizes margins, borders, padding, and content dimensions. You can toggle checkboxes to disable individual rules and see changes instantly.
You can edit HTML and CSS right in the Elements panel. Double click any tag name to rename it. Change <h1> to <h2> and the page updates immediately. Double click attribute values to modify them, or right click a node and choose Edit as HTML to rewrite entire blocks. In the Styles pane, click any CSS value and type a new one. Change color: black; to color: red; and text turns red. Add new properties by clicking in the blank space below existing rules. These edits are temporary (they disappear on reload), but they’re perfect for testing layout tweaks, color schemes, or spacing adjustments before committing changes to your stylesheet.
What the Computed panel gives you:
- Exact computed values. See the final pixel width, the actual font size after inheritance, and resolved color codes even when your CSS uses relative units or variables.
- Box model view. A visual diagram showing content, padding, border, and margin in pixel dimensions, plus the ability to click and edit those values live.
- List of applied CSS rules. Every rule that touched the selected element, with file names and line numbers, so you can trace styles back to their source.
Network Panel Basics for Beginners Debugging JavaScript
The Network panel records every HTTP request your page makes: HTML documents, CSS files, JavaScript bundles, images, fonts, and API calls. Each request shows up as a row with the URL, HTTP method (GET, POST, etc.), status code (200, 404, 500), response size, and time taken. The timeline view shows when requests started, how long they waited, and when responses arrived. Useful for spotting slow resources or API delays. You can sort by size, time, or type, and filter by resource category (XHR, JS, CSS, Img) to focus on what matters.
To debug API calls, click the XHR or Fetch/XHR filter button to show only AJAX and fetch requests. Click any request to see detailed tabs: Headers (request and response headers, including cookies and auth tokens), Preview (a formatted view of JSON or HTML responses), Response (the raw response body), and Timing (a breakdown of DNS lookup, connection, SSL handshake, and server response times). If your fetch call returns a 404 or weird data, the Network panel shows exactly what the server sent back and what your code asked for. No more guessing why data is missing or wrong.
Turn on Preserve log (checkbox at the top of the Network panel) to keep request history across page reloads. Check Disable cache to force the browser to fetch fresh copies of every resource instead of loading from cache. These settings help reproduce bugs that only show up on first load or when cache is stale. If a bug only happens on reload, preserve log lets you scroll back and compare requests before and after the refresh.
Responsive Design and Device Simulation in DevTools

DevTools include device emulation modes that simulate different screen sizes, pixel densities, and mobile browsers without needing a physical phone or tablet. In Chrome, click the Toggle device toolbar icon (looks like a phone and tablet) or press Ctrl + Shift + M (Windows/Linux) or Cmd + Shift + M (Mac). In Firefox, open Responsive Design Mode from the menu or press Ctrl + Shift + M / Cmd + Option + M. A toolbar appears above the page with preset device profiles (iPhone SE, iPad, Galaxy S20) and custom dimension inputs. Pick a preset or type your own width and height to test any screen size.
Device Mode simulates more than just viewport size. You can adjust pixel density (DPR) to test high-resolution displays, turn on touch simulation to mimic swipe and tap gestures, rotate the viewport between portrait and landscape, and throttle network speed to see how your page loads on 3G or slow connections. The simulated browser includes mobile user-agent strings, so server-side code and analytics see a mobile visitor. You can even simulate geolocation, device orientation sensors, and idle detection for advanced testing, though beginners usually stick to screen size and touch behavior.
Final Words
Open DevTools, use the menu paths or shortcuts, and try the Console as a quick REPL where alert and console.log show different results.
You practiced core commands (log, warn, error, assert), explored variables, objects, and the DOM (createElement, innerHTML, style), set breakpoints and used the debugger, inspected Elements, watched network requests, and tested responsive layouts.
This is a practical primer on how to use console and browser devtools for javascript beginners — try these steps in your browser and you’ll feel more confident fast.
FAQ
Q: How to use browser console for JavaScript?
A: The DevTools console for JavaScript lets you type and run JS interactively: open Console, enter expressions and press Enter, use console.log to print, Shift+Enter for multiline, and Up/Down to recall commands.
Q: How do I open the dev console in JavaScript?
A: Opening the dev console in JavaScript is done using DevTools: Chrome — Ctrl+Shift+J (Win/Linux) or Cmd+Option+J (mac) or Chrome menu > More tools > Developer tools; Firefox — Ctrl+Shift+K or Cmd+Option+K.