

What if doctors treated everyday care like a series of experiments instead of one-off guesses?
Practice-Based Learning and Improvement puts that idea into action.
It asks physicians to measure their work, spot gaps, test small changes, and repeat.
In this post you’ll see how clinicians use self-assessment, evidence searches, and quick quality-improvement cycles (like PDSA) to judge and improve care.
You’ll get practical steps and clear signs of success so you can run your own small tests and actually change patient outcomes.
Foundations of Practice‑Based Learning and Its Role in Clinical Improvement

Practice-based learning and improvement sits right at the center of how doctors develop over time. It’s one of six core competencies the Accreditation Council for Graduate Medical Education laid out, and it asks for something specific: continuous assessment of your clinical work and systematic improvement based on what you find. Most competencies focus on what you know or how you talk to patients. PBLI is different. It requires you to measure your own performance, spot the gaps, and use evidence-based methods to close them. You’re not waiting for someone else to fix things. You’re the one making it better.
The whole thing runs on a loop. You find a gap between what you’re doing and what the evidence says you should be doing. You collect baseline data to see how big the problem is. You set a goal. You test changes using quality improvement methods. Then you measure whether those changes actually worked. While this happens, you’re pulling in new evidence from journals, thinking about your decisions, and writing it all down in ways that meet accreditation requirements. It never stops. Improvement isn’t a project you finish, it’s a way of working.
A few frameworks guide the work and keep it from turning into chaos. The plan-do-study-act cycle is probably the most common. Four steps, you repeat them, you test small changes fast. Root cause analysis helps you dig into why errors happen instead of just blaming someone. Lean and Six Sigma cut waste and variation out of processes. Run charts and control charts let you see your data over time so trends don’t hide in spreadsheets. Most PBLI projects during residency last three to twelve months. If you’re using run charts, you usually need twelve to eighteen data points before you can say something real changed.
What you actually do in PBLI:
- Self-assessment and gap identification – figuring out where you or your team fall short of standards
- Evidence-based medicine integration – searching research, deciding if it’s good, applying it to real patients
- Measurement of care processes and outcomes – tracking what you do and what happens to patients in numbers
- Quality improvement methodology – using structured tools like PDSA or root cause analysis to test changes and see if they stick
- Documentation for trainee evaluation – capturing what you learned and what you did so it counts toward milestones and competency reviews
Key Practice‑Based Learning Skills and Clinician Competencies

You need specific skills to pull off PBLI. Self-directed learning comes first. You’ve got to identify your own gaps without waiting for someone to point them out. That takes honest self-assessment, often backed up by chart audits, direct observation, or patient outcomes. Once you see the gap, you set a learning goal, pick resources or interventions, and check later to see if you closed it. The cycle gets faster the more you do it.
Reflective practice is the second piece. After a patient encounter, a procedure, or a quality improvement test, you stop and ask what went well, what could’ve been better, and what you’ll change next time. Reflection is what turns experience into learning. Tools like learning portfolios, milestone assessments, and entrustable professional activities help you document this and show you’re progressing. Chart audits, 360-degree feedback, simulation, knowledge tests—all of that feeds into evaluations and gives program directors the data they need to decide if you’re competent.
Reflective Practice and Feedback Integration
Asking for feedback and actually using it separates people who keep getting better from people who plateau. PBLI requires you to seek feedback from peers, supervisors, nurses, patients. You don’t wait for your annual review. A growth mindset helps here. If you believe skills develop through effort instead of being fixed, you can hear criticism without getting defensive. When feedback shows you a gap, you update your plan and try something different the next time around.
Feedback behaviors that make PBLI work:
- Actively request specific feedback after procedures or patient encounters instead of asking “how’d I do?”
- Listen without defending yourself when you get constructive input, even if it stings a little
- Write feedback into a learning plan with concrete steps and a timeline you can actually follow
- Give useful feedback to others by observing carefully and focusing on behavior instead of personality
Quality Improvement Cycles Within Practice‑Based Learning

Quality improvement cycles power the whole thing. Plan-do-study-act is the most common setup. Four steps borrowed from industry and tweaked for hospitals. In the plan phase, you define the problem, set a clear aim, pick one or two things to test. In the do phase, you run the change on a small scale—one provider, one clinic day, a handful of patients. In the study phase, you look at the data to see if it worked and what side effects popped up. In the act phase, you decide whether to keep the change, tweak it, or dump it. Then you start again. Most trainee projects run two to four PDSA cycles over three to twelve months.
You need baseline measurement before you start. If you don’t know where you are, you can’t tell if you moved. Baseline data collection usually runs four weeks to three months depending on how often the thing you’re measuring happens. Let’s say you want more sepsis patients getting antibiotics within one hour of recognition. You might audit twenty to thirty consecutive cases to find your starting percentage. Once you have that, you write a SMART aim. Specific, measurable, achievable, relevant, time-bound. Something like: “Increase sepsis patients receiving antibiotics within one hour from sixty percent to eighty-five percent over six months.”
| Step | Typical Duration | Notes |
|---|---|---|
| Plan | 2–4 weeks | Define problem, set aim, choose interventions, design data collection |
| Do | 1–8 weeks per cycle | Implement change on a small scale; document process and context |
| Study/Act | Ongoing | Analyze data, refine intervention, decide to adopt/adapt/abandon |
PDSA works because it’s fast and small. You’re not redesigning an entire system at once. You test one thing, learn what happens, build on it. Run charts and control charts show your data over time. A run chart puts your measure on the vertical axis, time on the horizontal. When you see shifts, trends, or runs above or below the median, something changed. Twelve to eighteen data points usually separate real improvement from random noise. This iterative approach turns vague goals into concrete progress and gives you confidence to spread what works.
Measurement Strategies for Practice Improvement and Patient Outcomes

Measurement turns hope into proof. You collect data to answer three questions: Did we do what we said we’d do? Are patients better? Did we create new problems? Those map to process measures, outcome measures, and balancing measures. Process measures track whether you followed evidence-based steps. Like the percentage of heart failure patients who got discharge instructions, or median time from triage to first antibiotic in suspected sepsis. Process measures give you fast feedback because you control them directly. Change a workflow and the number shifts in days or weeks.
Outcome measures capture what happens to patients because of your care. Infection rates per thousand device-days. Thirty-day readmission percentages. Mortality rates. Patient-reported pain scores. Outcome measures take longer to move and get influenced by stuff you can’t control, but they’re the real goal—better health. Balancing measures watch for unintended consequences. If you cut hospital length of stay, you also track readmissions to make sure you’re not sending people home too early. If you push guideline adherence for antibiotics, you check rates of C. diff to avoid overuse.
You usually display data with run charts or statistical process control charts. Run chart is simple. Time on one axis, your measure on the other, a median line through the middle. Eight consecutive points above or below the median, or a clear trend over six or more points, signals that something changed. Control charts add upper and lower limits that show the range of normal variation. Data points outside those limits mean special cause variation you need to investigate. Both tools make improvement visible and keep teams honest about whether changes worked.
Metrics you’ll see in PBLI projects:
- Adherence percentages – proportion of patients getting a guideline-recommended intervention, like aspirin for acute coronary syndrome
- Infection rates per thousand device-days – central line-associated bloodstream infections, catheter-associated UTIs, ventilator-associated events
- Time-to-treatment intervals – door-to-antibiotic time in sepsis (minutes), door-to-balloon in STEMI (minutes)
- Readmission rates – percentage of patients back in the hospital within thirty days of discharge
- Medication reconciliation completion – percentage of discharge summaries with complete med lists reviewed with the patient
- Length of stay – mean or median hospital days, often a balancing measure when you’re improving throughput
Evidence‑Based Practice Integration in Practice‑Based Learning

Evidence is the fuel. PBLI asks you to find gaps, and the literature shows you what best practice looks like. Integrating evidence into daily work follows a process: write a focused clinical question, search the literature, synthesize guideline recommendations and primary research, pilot a local version of the evidence, measure whether it produces the expected outcome. It’s the scientific method applied to your own practice.
Lots of PBLI projects start when someone notices local practice doesn’t match published guidelines. A resident sees that only sixty percent of heart failure patients get discharge counseling on daily weights and fluid restriction when the guideline says one hundred percent. The resident searches for evidence on discharge education, finds systematic reviews and QI reports from other hospitals, adapts a checklist and teach-back protocol to fit the local workflow. Then tests it with a small group, measures completion and thirty-day readmission, refines based on feedback from patients and nurses. Evidence gives you the target. Improvement cycles give you the method to hit it.
Steps for Applying Evidence in Clinical Settings
Start by turning your improvement gap into a searchable question. PICO framework helps—patient population, intervention, comparison, outcome. Search PubMed, Cochrane, clinical guideline databases for systematic reviews, meta-analyses, national society guidelines. Go for high-quality evidence but remember context matters. A protocol that works in a big academic center might need tweaking for a small community hospital. Pilot the change small and collect data on uptake and outcomes. Refine based on what you learn. Spread if it works.
How to integrate evidence into PBLI:
- Formulate a focused clinical question using PICO or something similar to sharpen your search
- Search guideline databases and journals for systematic reviews, meta-analyses, clinical practice guidelines relevant to your question
- Adapt the evidence to local context by talking to stakeholders—nurses, pharmacists, patients—and designing a workflow that fits
- Pilot the change and measure uptake using process and outcome measures to see if the evidence-based practice improves care
Real‑World PBLI Improvement Project Examples
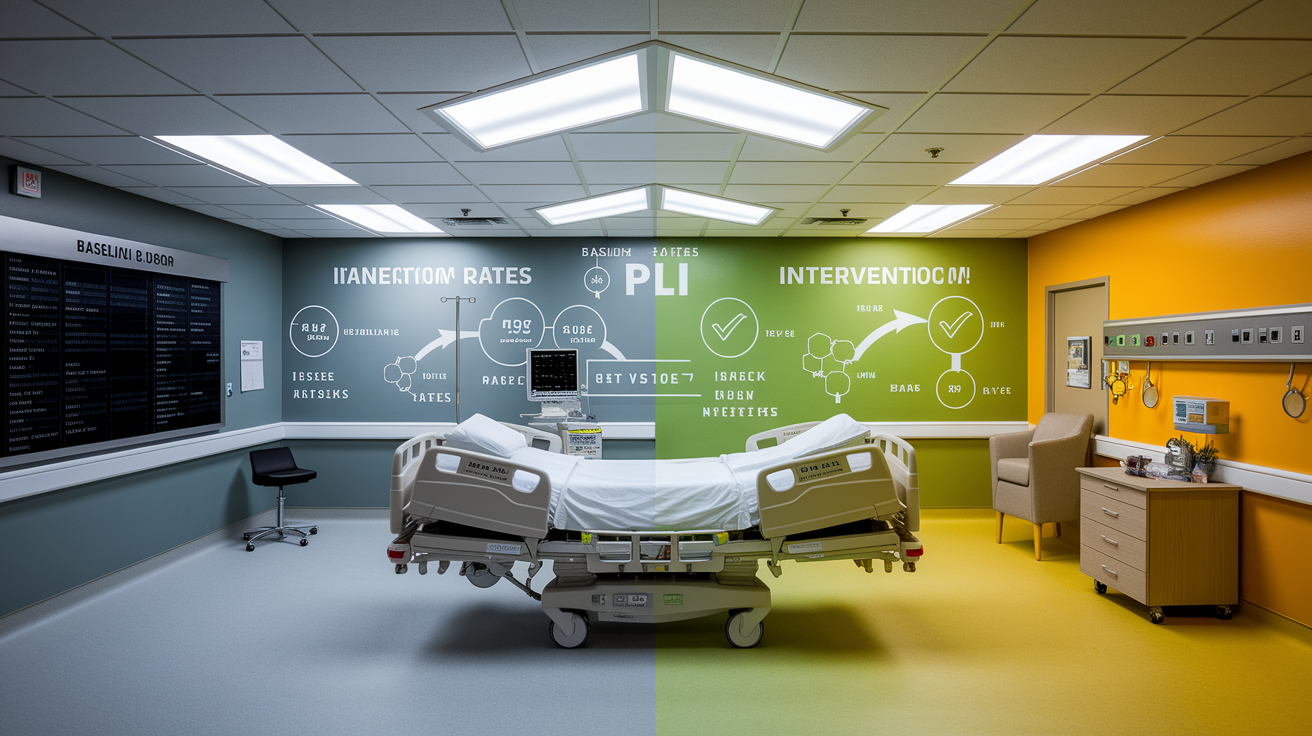
Seeing how other teams do it makes designing your own project easier. A hospital medicine team wanted to reduce central line-associated bloodstream infections. They audited baseline data for three months and found a rate of four per thousand central line days, way above the national benchmark. Their SMART aim: reduce the rate to under two per thousand line days within twelve months. They tested a bundle—daily review of line necessity, standardized insertion checklists, nurse-driven reminders—through three PDSA cycles. After each cycle they reviewed the run chart, tweaked the intervention, spread successful changes to more units. At twelve months the infection rate hit one point five per thousand line days. Sixty-two percent reduction from baseline.
Another example from an emergency department trying to cut median time from triage to provider assessment. Baseline over eight weeks showed forty-five minutes. Goal: thirty minutes within six months. They tested a triage protocol letting nurses order basic labs and imaging before the doctor saw the patient, and they adjusted physician coverage during peak hours. Two PDSA cycles showed the protocol worked for low-acuity patients but created bottlenecks for high-acuity cases. They adapted it to apply only to patients with Emergency Severity Index levels three through five and added a visual dashboard so staff could see wait times in real time. By six months, median time to provider was twenty-eight minutes and patient satisfaction scores went up.
| Project Type | Baseline | SMART Aim | Duration |
|---|---|---|---|
| Improve guideline adherence for heart failure discharge counseling | 60% completion of education checklist | Increase to ≥90% within 9 months | 9 months, 3 PDSA cycles |
| Reduce device-associated infections in ICU | 4 infections per 1,000 device-days | Reduce to <2 per 1,000 device-days in 12 months | 12 months, 3 PDSA cycles |
| Decrease ED median time to provider assessment | 45 minutes | Reduce to 30 minutes within 6 months | 6 months, 2 PDSA cycles |
A third project focused on medication reconciliation at discharge. Baseline audit showed only fifty percent of discharge summaries had a complete, reconciled med list reviewed with the patient or caregiver. Aim: eighty-five percent over six months. They added a standardized discharge template in the electronic health record, trained residents and pharmacists on reconciliation, added a hard stop requiring completion before the discharge order could be signed. After two PDSA cycles and tweaks based on user feedback, completion hit eighty-eight percent. They tracked thirty-day readmissions as a balancing measure and saw no increase, suggesting the intervention didn’t cause unintended delays or errors.
Practical Implementation Strategies for Practice‑Based Learning and Improvement

You need planning, team support, and protected time for PBLI projects to work. Start with a small team, two to eight people who care about the problem and have the authority to test changes. A resident-led project might include a faculty mentor, a nurse, a pharmacist, a QI coach. Define roles clearly—who collects data, who runs meetings, who talks to stakeholders. Write a one-page charter with the problem statement, SMART aim, key measures, planned interventions, timeline. The charter keeps you focused when things get messy.
Baseline data collection takes four to twelve weeks depending on how often the event happens. Use this time to map the current workflow, spot variation, talk to frontline staff. People support what they help create, so bring in nurses, clerks, other team members early. Once you’ve got baseline data, launch your first PDSA cycle with a small test. One provider, one clinic session, one patient population. Collect data in real time if you can. Review results at least weekly during active intervention periods. Most projects schedule monthly formal reviews where the team looks at run charts, talks about what’s working, plans the next cycle.
Protected time matters for trainees. Programs should give four to eight hours per month for PBLI work, either in blocks or woven into clinical rotations. Faculty mentorship is just as critical. Projects succeed more often when a mentor helps with study design, data interpretation, navigating institutional roadblocks. Plan for sustainability from the start. Ask how you’ll keep the improvement going after the project ends, who’ll keep monitoring data, how you’ll train new staff on the improved process.
Steps for implementing a PBLI project:
- Form a multidisciplinary team of 2–8 members with clear roles and a mix of frontline staff and leadership
- Identify a specific gap or problem using audit data, incident reports, patient feedback, and confirm stakeholders care about it
- Collect baseline data for 4–12 weeks to nail down current performance and understand variation
- Draft a SMART aim that nails the measure, target, timeframe, and write a one-page project charter
- Test one or two interventions in a small PDSA cycle and collect data on process adherence and early outcomes
- Review data weekly or biweekly during active cycles and adjust based on what you learn; spread successful changes after 2–3 cycles
Patient Safety Alignment in Practice‑Based Learning
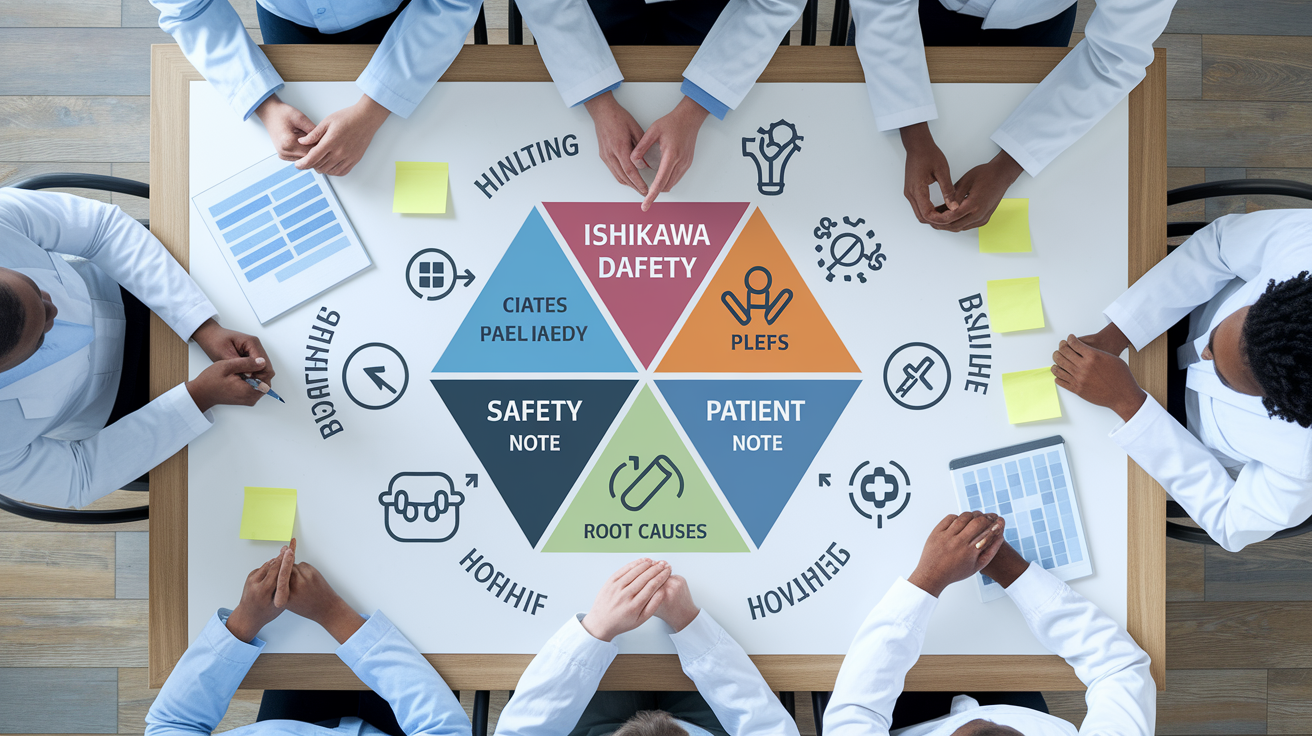
PBLI and patient safety go together. Most PBLI projects aim to cut preventable harm—infections, med errors, delayed diagnoses, procedural complications. When something serious happens, root cause analysis is the main tool for learning. A team reconstructs what happened, finds contributing factors at the system and individual levels, recommends changes to prevent it from happening again. PBLI competency requires you to participate in root cause analyses, understand the difference between individual error and system failure, apply the lessons to your own work.
Outcome measures in safety-focused projects often get expressed as rates per thousand patient-days or device-days, which makes it easier to compare across units and institutions. A ventilator-associated event rate of three per thousand ventilator-days lets you benchmark against national data. Balancing measures matter in safety work because interventions can backfire. If you add a medication safety protocol requiring pharmacist verification before administration, you track time to first dose to make sure delays don’t hurt patients needing urgent treatment. Regular review of balancing measures protects against unintended consequences and keeps improvement honest.
Patient-safety practices in PBLI:
- Conduct root cause analyses after serious events and share findings with the team in a structured, blame-free way
- Track outcome measures as rates per thousand patient-days or device-days so you can compare with benchmarks and spot improvement over time
- Monitor balancing measures to catch unintended consequences like increased workload or new bottlenecks
- Engage frontline staff in safety rounds and audits to find hazards before they cause harm and build transparency
- Integrate safety goals into PBLI project aims by aligning improvement work with institutional safety priorities and national initiatives
Assessment and Accreditation Requirements in PBLI

Accreditation bodies and specialty boards want documented proof of practice-based learning. For residents and fellows, clinical competency committees review PBLI performance at milestone checkpoints, usually every six months. Evidence includes participation in QI projects, chart audits, multisource feedback, reflective portfolios, direct observation of feedback-seeking. Programs have to document that you can identify gaps, set learning goals, apply QI methods, measure outcomes. This feeds into decisions about promotion, remediation, readiness for independent practice.
For practicing physicians, PBLI expectations continue through continuing medical education and maintenance of certification cycles. Most specialty boards require a certain number of QI or patient safety credits for recertification. You earn credits by completing approved QI projects with a clear aim, baseline and follow-up data, documented interventions, reflection on what you learned. Lots of institutions offer QI training and project templates that meet board requirements, making it easier to fold improvement work into professional development. The goal is making continuous learning and measurement a habit, not a checkbox you tick every ten years.
PBLI Documentation Elements
Documentation should tell the whole story: what gap you found, what you did, what happened, what you learned. A strong portfolio includes project charters, run charts with notes on when you made changes, pre- and post-intervention data summaries, written reflection describing challenges, adaptations, plans for keeping it going. If it was a team effort, clarify your role. Include evidence of feedback integration—a learning plan you updated after a chart audit, a change in practice after 360-degree feedback.
Evidence needed for PBLI competency assessment:
- Documented participation in at least one QI project with a clear aim, baseline data, interventions, outcome measures
- Chart audits or direct observation reports showing self-assessment and identification of practice gaps
- Multisource (360-degree) feedback summaries with evidence of reflection and behavior change in response
- Reflective portfolio entries connecting clinical experiences to learning goals and showing progression over time
Final Words
Jump into action: pick a practice gap, set a SMART aim, measure a baseline, and run PDSA cycles using run or control charts. Use reflective practice, chart audits, and evidence to guide each change.
Tie outcomes to patient safety metrics, track balancing measures, and document work for accreditation. These steps turn ideas into measurable gains you can show.
Practice based learning and improvement is a practical, repeatable path. Start small, celebrate small wins, scale what works, and you’ll keep improving.
FAQ
Q: What is practice-based learning and improvement?
A: Practice-based learning and improvement is a clinician process using self-assessment, evidence-based practice, measurement, and QI methods (like PDSA) to close care gaps and improve patient outcomes continuously.
Q: What are the 4 principles of OBE by Spady?
A: The four principles of OBE by Spady are clarity of focus, designing down from desired outcomes, high expectations for learners, and expanded opportunities for learning and assessment.
Q: What’s the difference between PBL and CBL?
A: The difference between PBL and CBL is that problem-based learning has students drive solving open-ended problems, while case-based learning uses teacher-guided clinical cases to apply knowledge to specific scenarios.
Q: What are the 9 components of CBT?
A: The nine components of CBT are assessment; psychoeducation; cognitive restructuring; behavioral activation; exposure; behavioral experiments; problem-solving; skills and relaxation training; and relapse-prevention with homework.